

What Does a Smart Home Lead Really Cost? (Google Ads, SEO, Social & the Math Dealers Miss)
- Rob Skuba
- Apr 24
- 11 min read
Updated: Apr 25
The $1,000 Smart Home Lead Nobody Talks About

Lately, I’ve been seeing a lot more interest in Google Ads (AdWords) than usual. Even in forums and groups where dealers are asking for help running ads, the most common response is: “Yes, we can help.”
I think anyone can run a Google Ad but there’s a massive difference between simply “running ads” and actually understanding all the variables that determine whether you’re getting the most out of them.
I’m writing this to help you understand the basics so you can make an educated decision, not just on Google, but across the most common ad platforms and what you should realistically expect from each. I also think it’s important that if we’re comparing marketing dollars and your investment of time, we include the return from SEO and organic social posts as well.
The Reality Check
If you’ve been running ads, posting on social, or working with a marketing company, you’ve probably had this thought:
“We’re spending money… but I don’t really know what we’re getting back.”
No guesses.
No "it feels like it's working."
No PDFs full of colorful graphs.
Just actual numbers.
Most dealers don’t have that answer. They know what they spend every month and they might even know what a “lead” costs. But when you ask the simplest question in business—“What does it cost you to actually close a job?”—things get quiet.
The Problem Isn’t the Platform
It’s not Google, Facebook, or even your own website. The real problem is that you only have pieces of the equation… never the full answer. You’re told what a click or lead costs, but you’re never shown what it takes to turn those things into revenue. Because you're missing the full picture, every marketing decision you make becomes a guess.
But here is the part nobody wants to say out loud: Most agencies don’t know either. They are happy to report on "Impressions" and "Click-Through Rates" because those are the numbers their software spits out. It’s easy to report on activity, but it is much harder to report on revenue. They stay at the surface level because they don't understand the "High-Friction" nature of a $50k smart home sale. If your agency stops their analysis at the "Lead" stage, they aren't managing your growth, they are just managing your spend.
When neither the dealer nor the agency knows the cost of a closed job, you aren't running a strategy, you’re running a charity for Google.

Section 1: The Reverse Math of a Closed Job
Most dealers look at marketing from the top down. They ask: “How many clicks did we get?” or “How many leads came in?” But that’s the wrong direction, your business doesn’t run on clicks, and it doesn't run on leads, it runs on closed jobs. The question we really need to ask is: “What does it take to close one job?” Then, you work backward from that "Yes."
A Real-World Example (Smart Home / Theater)
Let’s say your average project is a $40,000 – $70,000 installation. To land one of those jobs, your funnel usually looks like this:
1 closed job
comes from about 2–4 in-home meetings
which come from about 5–10 real conversations
which come from about 25–30 qualified leads
which come from about 100–200 website visitors
which come from paid or organic clicks
Now Put Numbers to It
A healthy, normal funnel in this industry looks like this:
150 visitors → 7 leads (5%) → 4 real conversations → 2 meetings → 1 job
Once you see the chain, you can finally ask the only question that matters:
What did it cost to get those 150 visitors? Depending on what you pay for a click, your reality changes:
At $8 per click → $1,200 to win the job
At $15 per click → $2,250 to win the job
You don’t scale a business by lowering your cost per lead, you scale by understanding what it takes to win a job.
Section 2: The Demand Conversion Chain
Before we get into the platforms, we need to define how a stranger becomes a customer. Not in theory, but in real life and we call it The Demand Conversion Chain:
Clicks → Visitors → Leads → Calls → Meetings → Closed Jobs
Where Most Dealers Get It Wrong
Most dealers only track one step: Leads. They see form fills and assume that equals progress but a lead is just a name. It doesn’t tell you if they’ll answer the phone, if they’re qualified for a $30k system, or if they’ll ever buy.
Why This Matters: The Drop-Off
Every step in this chain has a "drop-off", where your money disappears.
Slippage: Not every click on your ad gets to your landing page (20–30% loss)
Friction: Not every visitor becomes a lead
Ghosting: Not every lead answers your call
No-Shows: Not every call becomes a meeting
The Breakdown (2026 Benchmarks)
100 clicks
→ ~70 real visitors (after slippage)
→ 5 leads (5% conversion)
→ 3 real conversations
→ 2 meetings
→ 1 closed job
Marketing doesn’t fail at the click, it fails somewhere in that chain.

Section 3: Cross-Industry Analysis (The Luxury Service Gap)
To understand your cost, you have to look at the market. Smart home automation is a luxury service, but it competes in the same ad auctions as emergency trades.
Cross-Industry Cost Comparison
Industry | Google Search CPL | Facebook CPL | YouTube (Video) CPL |
Smart Home / AV | $135 – $160 | $45 – $65 | $85 – $110 |
HVAC | $198 | $63 | $95 |
Plumbing | $167 | $73 | $85 |
Electrical | $163 | $58 | $75 |
Roofing | $215+ | $115+ | $140 |
Why the gap exists:
In plumbing, people are solving distress problems, like a burst pipe,. they call the first person they see.
In the smart home world, people are making decisions.
Higher ticket
Longer timelines
More trust required
More touchpoints before moving forward
That’s why your lead-to-close ratio is often wider than a plumber’s, even if your lead cost looks slightly lower on paper.
Section 4: Google Ads — The Cost of Search Intent
Inside the Google dashboard, the numbers look manageable ($5–$8 clicks) but that number only tells you what it costs to get attention. It is not telling you what it costs to get a customer.
The Keywords That Actually Matter
Motorized Blinds ($4–$8 CPC) — researching a product
Home Theater Installation ($8–$18 CPC) — looking for a service
Control4 Dealer Near Me ($12–$25 CPC) — ready to hire
The Slippage Factor
Not every click becomes a visitor because on average, about 20% of paid clicks never reach your site due to misclicks, load time, or user drop-off.
$1,000 for 100 clicks = ~70 real visitors
Google doesn’t determine your cost, your funnel does.

Section 5: Social Media — Why “Cheap Leads” Get Expensive Fast
Social media is interruption-based, you are showing up while someone is scrolling, not searching.
The Social Funnel Math:
When you run a campaign on Meta or TikTok, the top-line numbers look great, but here is how the math actually plays out once you filter for intent:
$2,500 spend (100 leads at $25 each)
→ ~50% respond (the rest ghost or provided bad info)
→ ~25 real conversations (people actually interested in talking)
→ 10–15 meetings (qualified prospects on the calendar)
→ 3–5 jobs closed (signed contracts)
Real cost per customer: $500 – $800
The Hard Truth
Social media doesn’t lower your cost; it shifts where you pay for it. You either pay more for the click (Google) or you pay more in labor and time to chase the lead (Social).
Section 6: YouTube — Building Demand Before the Search
The channel most dealers ignore or misunderstand, because YouTube is where trust starts. At $0.05 – $0.30 per view, it is the cheapest way to pre-sell a homeowner.
It acts as a multiplier.
Without YouTube:
100 clicks → 5 leads → 1 job
With YouTube:
100 clicks → 8 leads → 2 jobs
YouTube doesn’t capture demand, it shapes it before it exists.
Section 7: Management Cost — The Missing Line Item
You hear it in every dealer meeting: "We spent $1,500 on Google last month" or "Our leads cost $80 each." But there is another cost most dealers either ignore or completely underestimate: Management.
Whether you are paying someone else or doing it yourself, running a high-intent campaign isn't free. That cost usually comes in three flavors:
The Agency Fee: $500–$2,000/month (or a percentage of your spend).
The Freelancer: $300–$1,000/month.
Internal Time: Often $1,500–$3,000/month in lost opportunity cost if you are the one clicking the buttons.
Why It Matters
If you are spending $1,500 on Google and paying an agency $1,000 to manage it, your real monthly investment isn’t $1,500. It’s $2,500.
When you run that through your CPAR™, the math changes instantly. If that campaign produces two closed jobs, your cost per customer isn't $750. It is $1,250. You have to account for the "Hands on the Wheel" if you want to know your true ROI.
The Mistake Dealers Make
Most dealers try to eliminate the management cost to "save money." They think, "I'll just do it myself" or "I'll hire the cheapest person I can find." This almost always backfires. It leads to poorly structured campaigns, wasted clicks on DIY terms, and inconsistent results.
The reality is that management isn't the problem—bad management is. A professional who understands the variables in our industry will lower your CPAR™ by fixing the chain, even with their fee included. A "cheap" manager will increase your CPAR™ by wasting your ad spend on curiosity clicks.
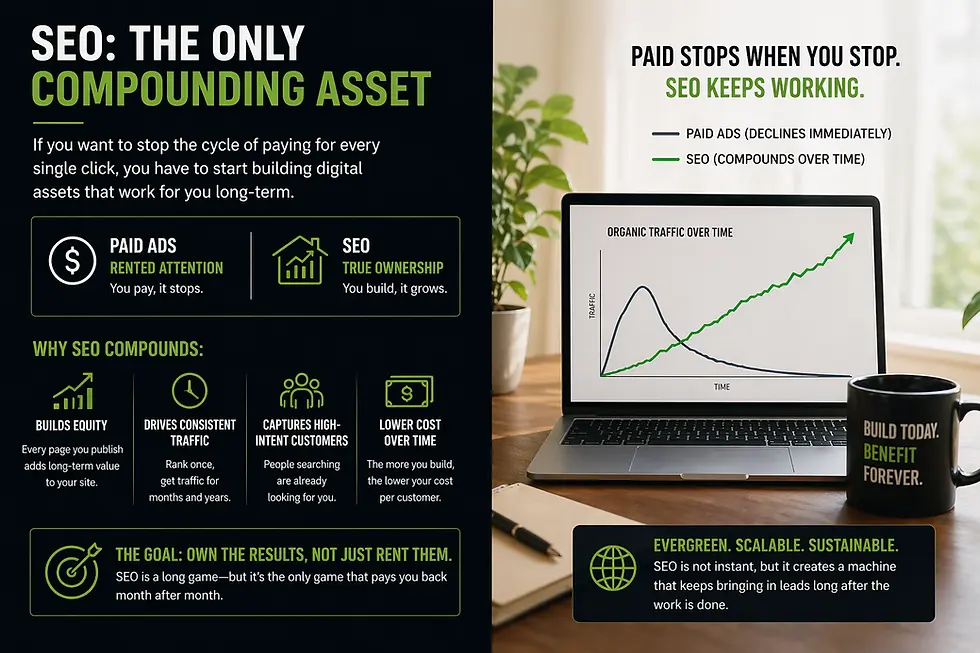
Section 8: SEO — The Only Compounding Asset
If you want to stop the cycle of paying for every single click, you have to start building digital assets that work for you long-term. Think of it this way: paid ads are rented attention, while SEO is true ownership.
For example, look at a properly built “Motorized Blinds” authority page. You might invest $1,500 upfront to build and optimize that page correctly. That’s roughly the same as one month of ad spend for most dealers. When you compare the two, the math tells the real story:
Paid Ads:
You spend $1,500 for roughly 150 clicks (at a $10 CPC). If your funnel is working, that might result in one closed job. However, the second the month ends and the budget runs out, the traffic stops completely.
SEO Page:
You make a $1,500 one-time investment to build the asset. Even with a conservative estimate of just one lead per month, you’ve generated 18 leads over 18 months without ever paying for another click.
That is the fundamental difference, Ads give you speed, but SEO gives you stability. Unlike an ad, which disappears the second you stop paying, an SEO page keeps working for you. It builds trust, shows up when homeowners are actively searching, and actually improves your performance across every other channel.
You’re not necessarily choosing one or the other, you’re deciding how long you want to keep paying for the same result.
Section 9: Organic Social — The Time Trap
Most dealers think posting social media is free because there isn’t a monthly invoice from Google or Meta. But it is only "free" if your time has no value, if you spend just one hour a day taking photos on jobs, editing videos, and writing captions, that adds up to roughly 20 hours every month. At a professional rate of $150/hr, you are actually spending $3,000 a month in lost opportunity. That is time you aren't spending meeting with clients, closing deals, or managing high-level installs.
The return on that investment is often lower than dealers want to admit. Most organic posts only reach 1–3% of your followers, and most if not all your engagement comes from other dealers, vendors, or friends rather than active buyers. While you might get a few likes or the occasional comment, organic social does not produce consistent, qualified inbound leads. It feels productive because it’s "activity," but activity doesn't always grow a business.
Organic social does have a role: it keeps you visible, reinforces your brand, and supports trust when a prospect looks you up. However, it becomes a trap when it’s a default habit instead of a clear strategy.
Bottom Line: If your social media isn’t tied to revenue, it’s just activity.

Section 10: Cost Per Acquisition Reality (CPAR)
To grow your business, you have to stop measuring activity and start measuring outcomes. Most marketing reports focus on clicks and leads, but those are just milestones. The only number that actually matters to your bottom line is your CPAR, the real cost to turn a total stranger into a paying customer.
When you look at your business through the lens of The Demand Conversion Chain, the math becomes undeniable.
For example:
100 clicks
→ 5 leads
→ 3 real conversations
→ 2 in-home meetings
→ 1 closed job
If those clicks cost you $10 each, your CPAR is $1,000.
Now put that against your business:
If your average project profit is $8,000, that $1,000 is a smart investment.
If your profit is only $1,500, you have a serious problem.
The mistake most dealers make is trying to fix a high CPAR by chasing cheaper clicks, but that’s not where the leverage is. The real opportunity is improving conversion at each step of the chain.
If you improve your website and follow-up so your conversion rate moves from 5% to 8%, your CPAR can drop by roughly 40% without increasing your ad spend at all.
See how this plays out in real dealer case studies
👉 Bravo AV
Section 11: The Strategic Shift (Why Specs Don’t Sell)
The math and the metrics are what get you in the door, but the message is what actually gets you the job. Most dealers fall into the habit of marketing like technicians. They talk about 8K resolution, lighting protocols, and specific equipment brands. They walk into a home and try to sell the "how" before the homeowner even understands the "why."
In reality, homeowners don't buy technology, they buy the outcome that the technology provides. They are looking for movie nights that actually work, the comfort of a home that responds to their needs, the simplicity of a single-button "Goodbye" scene, and the confidence that their system won't fail when they host friends. When you shift your message from technical specs to emotional benefits, the friction in your sales process begins to disappear.
Conclusion: The Future of Your Growth
If your marketing feels inconsistent or your leads feel unpredictable, it’s usually not a problem with the platform. It is almost always a combination of incomplete math, broken steps in your conversion chain, or messaging that fails to connect with the homeowner’s reality.
Google, Meta, and SEO are all tools, but they only work if you understand the system behind them. Stop chasing the latest "hack" or buying clicks just to see your dashboard move. Start building digital assets that you own, fix the leaks in your conversion chain, and start measuring the only math that matters: the cost to turn a stranger into a client.

Rob Skuba
516-967-0039
Rob Skuba is a U.S. Army veteran and a 25-year veteran of the smart home and AV industry. He’s worked across every layer of the ecosystem, installation, distribution, manufacturing, design, sales, and consumer education, giving him a 360° understanding of homeowner behavior and dealer growth.
Rob has collaborated with top brands, supported legendary home theater designers like Theo Kalomirakis, and contributed to high-visibility projects from luxury homes to major entertainment spaces for 50 Cent. He’s the founder of National Smart Home, Lantern Room Marketing, Date Night In Stereo, and national awareness events including Smart Home Day, National 10-4 Day and National Headphone Day.


Comments